
Innovation and China’s Global Emergence
edited by Erik Baark, Bert Hofman, and Jiwei Qian
ISBN: 978-981-325-148-9
published August 2021
Or read this open access web edition
Chapter 8
PRC Industrial Policies Postdate Rather than Lead Economic Activity
Carsten A. Holz
Introduction
The industrial policies pursued in the People’s Republic of China (PRC) have attracted widespread attention. The 2015 policy of Made in China 2025, in particular, is generally viewed as creating an invincible economic powerhouse. Underlying such interpretations is the assumption that the PRC’s industrial policies have a decisive effect on resource allocation. The findings of this chapter suggest that this assumption is not valid.
Economists typically understand “industrial policy” to mean government measures “which attempt to speed the process of resource allocation among or within industrial sectors”, occasionally with an additional purpose such as “correcting market distortions” (Rutherford 1992), gaining an early comparative advantage, or creating a “national champion”. For the purpose of this chapter, industrial policy refers to sector-specific policies. These policies may incorporate elements of innovation policy, competition policy, growth policy or some other type of government economic policy.
Industrial policy is widely credited with having played a major role during East Asia’s phase of rapid economic growth (for example Wade 1988 and 1990; Amsden 1994). The view that the government can “pick winners” has since given way to justifying government intervention with information and coordination externalities (for example Rodrik 2004); government coordination may be beneficial in the presence of not only market failures or market imperfections, but also of learning effects or other positive externalities.
Today’s industrial policy has many dimensions, as Gao and Ru in this volume show, from resource mobilisation to infrastructure provision, research subsidisation, market protection and regulation. Subsidisation in the case of the PRC biotechnology industry includes loose rules around the sharing of medical information, state funding and centralised procurement processes that lower prices for generic drugs (Ballard 2019). An infant industry argument applies to PRC intellectual property rights as strategic industries are protected from global competition while themselves enjoying open, global markets (Li and Alon 2019).
The results of individual industrial policies in the PRC are mixed. For the shipbuilding industry, Barwick, Kalouptsidi and Zahur (2019) found that while industrial policy was successful in terms of boosting domestic investment in the industry, domestic entry and world market share, it also created large distortions, fragmentation, and underutilisation. For R&D inputs of large- and medium-sized firms, Eberle and Boeing (2019) found that subsidies crowd out private R&D investments (while overall R&D employment in firms increases) and increased investment rates for physical capital also reflect increased investment in residential buildings (not R&D). Soo and Jing (2019) documented the unsuccessful governmental attempts to establish a semiconductor industry going back to the 1990s and argued that the capability to reverse-engineer designs did not translate into the ability to innovate. Holz (2011) showed that the PRC does not strategically make use of positive externalities through linkage effects, in that the state does not channel state-owned enterprise activities into high-linkage sectors.
Implementation of industrial policy requires a capable administration. Prud’homme’s (2016) analysis of provincial Strategic Emerging Industries programmes suggests that administrative decentralisation in the PRC may lead to sub-optimal implementation of industrial policies. While some provinces pursue their comparative advantages and specialise appropriately, other provinces do not and instead pursue new developments likely to fail. Wu, Zhu and Groenewold (2019) found that the PRC’s five-year plans have significant impacts on the output growth of favoured industries, but only during the period of the five-year plan; political compliance with central directives and the availability of additional resources seem to be the leading drivers of policy implementation.
How success of industrial policy is measured varies across the literature. A regularly used criterion is output or productivity growth in the industry under consideration. For example, from 1998 to 2007, industrial policies directed at competitive sectors or fostering competition within a sector increased total factor productivity growth in the majority-private large- and medium-sized domestic firms, but this only held for subsidies and tax holidays, not for subsidised loans or tariffs (Aghion et al. 2015). From a macroeconomic point of view, a more appropriate criterion for the evaluation of industrial policy would be a measure of the economy-wide consequences of the policy, or a cost-benefit analysis for the particular application of government resources and government regulatory authority (suggesting the use of a computable general equilibrium model, an approach not taken in the recent literature).
This chapter bypasses the question of how to evaluate outcomes. It also does not focus on the different facets of industrial policies or on the individual means by which the government intervenes in the economy. Instead, it focuses on the one channel through which industrial policy is inevitably realised, investment, and examines the possible effects of industrial policies on investment. Whether the objective of industrial policy is innovation (product or process innovation) or economies of scale or consolidation, or any other objective, implementation will involve reallocation of capital, that is changes to investment patterns across sectors.
In the remainder of this chapter, six sets of industrial policies enacted since 2004 are introduced and their impact on the patterns of investment growth in industry is examined through regression analysis. Further analysis considers sector, administrative subordination, funding and ownership patterns of investment.[1]
Industrial Policies
Establishing investment priorities has long played an important role in the economic development of the PRC. In the second half of the 1950s, investment in 156 industrial projects established with the help of the Soviet Union laid the foundations of the PRC economy. In the Third Front Construction of the late 1960s and early 1970s, industrial investment was directed geographically according to military prerogatives. By the late 1980s, investment policy repeatedly assumed macroeconomic policy functions; for example, in the aftermath of the 2008 global financial crisis an aggregate investment push—which distinguished little between different types of projects—helped maintain economic growth.
A fundamental change in investment decision-making occurred in 2004. The State Council decreed that investment planning would morph into an investment approval procedure, transferring to the investing unit the investment initiative and extensive decision-making authority. Investment by non-state units became, in principle, no longer subject to government approval (State Council 2004).[2]
The government did not, however, fully surrender its influence over investment decisions. An appendix to the regulation listed restricted types of investment projects by sector that continued to require government authorisation. Direct government investment was still to occur in sectors where the market could not achieve an “effective allocation of resources”. The government continued its practice of setting out its priorities in five-year plans. And it began to issue a number of industrial policy measures intended to channel investment and productive activities into government-favoured endeavours. The following sub-sections briefly describe six sets of industrial policy measures issued since the early 2000s.[3]
A. Industrial Policies 2004–09
Three types of industrial policies emerged after the relaxation of investment controls in 2004:[4]
(i) Broad policies targeting more than one sector: priority investment catalogues for high-tech industries (2004, 2007, 2011) and foreign investors (2005, 2007), adjustment of the industrial structure (2005 and 2011), a Science and Technology Development Plan 2006–20, acceleration of service sector development (2007), technologies and products for import (2007, 2009, 2011) and industrial technology promotion (2009).
(ii) Policies targeting individual sectors: the automobile industry (2004), machine-building industry (2006), nine traditional sectors for revitalisation (2009),[5] information technology industry (2009), logistics industry (2009) and culture (2009).
(iii) Sector-specific ministry five-year plans.
Many of these policies are extensive in their coverage. For example, the 2005 guidance catalogue for adjustment of the industrial structure lists approximately 500 “encouraged” types of investment projects such as “Construction of a National Agricultural Products Base” and “Development of Inter-Regional Power Grid Engineering Technology”, 200 “restricted” types of projects and 400 types of projects to be “eliminated” (NDRC [National Development and Reform Commission], 2 Dec. 2015). The catalogue was revised in 2011 (NDRC 2013). A number of implementation instructions accompanied the catalogues, with later instructions reclassifying some projects.
B. Strategic Emerging Industries (2010)
In 2010, the State Council identified seven “strategic emerging industries” (zhanluexing xinxing chanye), with a target share in 2015 GDP of 8 per cent, and in 2020 GDP of 15 per cent (State Council 2010). The seven industries are: energy-saving and environmental protection technologies, next generation information technology, biotechnology, high-end equipment manufacturing, new energy, new materials and new energy vehicles. The document elaborates on each of these industries and then proceeds to list ways to support their development. Non-state (minjian) investment is explicitly encouraged.
These industries cannot be readily identified in the sector classification system because each cuts across the PRC’s sector classification system as published by the National Bureau of Statistics (NBS). For example, the “new energy” industry touches more than one sector in the sector classification system, and the sector classification system does not distinguish between “old” and “new” within any one sector.
The catalogue of strategic emerging industries was revised in 2013 and then again in 2016. In 2016, “digital innovation” was newly added as an eighth favoured industry, and the eight industries were broken down into 174 “key directions” with 4,000 products and services (NDRC 2017).
C. Twelfth Five-Year Plan (2011–15)
One of the 60 sections of the 12th Five-Year Plan (2011–15) covers the strategic emerging industries without, however, going into any further detail than the 2010 State Council document does.[6] Another section of the Plan covers nine traditional industries: equipment manufacturing, shipping, automotive, iron and steel, non-ferrous metals, building materials, petrochemicals, light industry and textiles. Further elaboration suggests that it is not so much the sector itself that is favoured but specific projects within a sector. A particular sector thus may comprise favoured and non-favoured projects, with an ambiguous overall effect on investment in this sector.
A key topic of the 12th Five-Year Plan was “structural change”, targeting a breakthrough for the strategic emerging industries and an increase in their share of the tertiary sector (that is, services) in GDP by four percentage points. The Plan also involved adjusting and “optimising” the investment structure, emphasised the important role of investment for domestic demand and encouraged non-state investment.
D. Supply-side Structural Reform (2015)
The “supply-side structural reform” agenda was first introduced by the Finance and Economics Leading Small Group of the Communist Party Central Committee in November 2015.[7] It comprises five elements, with the first three directly impacting investment: eliminating excess capacity, especially in steel and coal production; reducing stocks, mostly in real estate in second- and third-tier cities; de-leveraging across the economy; lowering costs, including those due to taxes, regulations and social security contributions; and a broad catch-all call for “strengthening weak points” (Naughton 2016).
The agenda does not involve draconian closure orders but represents a nod to publicly owned firms to merge and become more efficient, and the encouragement of local officials to implement environmental and other regulations and to eliminate the least desirable production capacities. A call to reduce excess capacity may also be a response to falling profitability and increasing losses at a time when prices for coal and steel were plummeting.
E. Made in China 2025 (2015)
On 8 May 2015 the State Council issued a circular titled Made in China 2025—the PRC version of Germany’s 2012 “Industry 4.0”—which encouraged a fourth industrial revolution towards “smart factories”.[8] Breakthroughs are to occur in ten priority industries: information technology, numerical control tools and robotics, aerospace equipment, ocean engineering equipment and high-tech ships, railway equipment, energy saving and new energy vehicles, power equipment, new materials, medicines and medical devices and agricultural machinery.[9] These ten priority industries dovetail with the 2010 seven strategic emerging industries, slightly rephrased, and the original “high-end equipment manufacturing” now reflected in several more narrowly defined categories.[10] A central leading group was set up and supporting documents were released.[11] Implementation of Made in China 2025 follows traditional PRC policy patterns with pilot cities (Ningbo being the first), annual targets and tasks, and assignment of responsibility for implementation.
Beyond identifying ten priority industries, Made in China 2025 does not favour certain sectors over others. Even in the case of the priority industries, investment need not increase for the sector in total but could shift between projects within a sector. An overall objective to become the leading manufacturing nation of the world in little more than thirty years suggests broad growth in manufacturing, with adjustments to how manufacturing is conducted within each sector rather than a drastic redirection of investment flows between sectors.
F. Thirteenth Five-Year Plan (2016–20)
The industry section of the 13th Five-Year Plan in three paragraphs lists comprehensive and industry-specific desirables.[12] The section elaborates in more detail on six sub-sectors and covers similar ground as the original seven strategic emerging industries (2010) and Made in China 2025:[13] acceleration of the development of high-tech industries, revitalisation of equipment manufacturing, optimal development of the energy industry, adjustment of the raw materials industry, an increase in the level of light industry and promotion of information technology.
Beyond these specifically listed industries, the coverage of the Plan is far-reaching, covering virtually every aspect of industry. Except for some raw materials industries singled out for a reduction in excess capacity, the Plan is not so much about promoting particular sectors as about various forms of upgrading within each sector.
Matching Industrial Policies into the Sector
Classification System
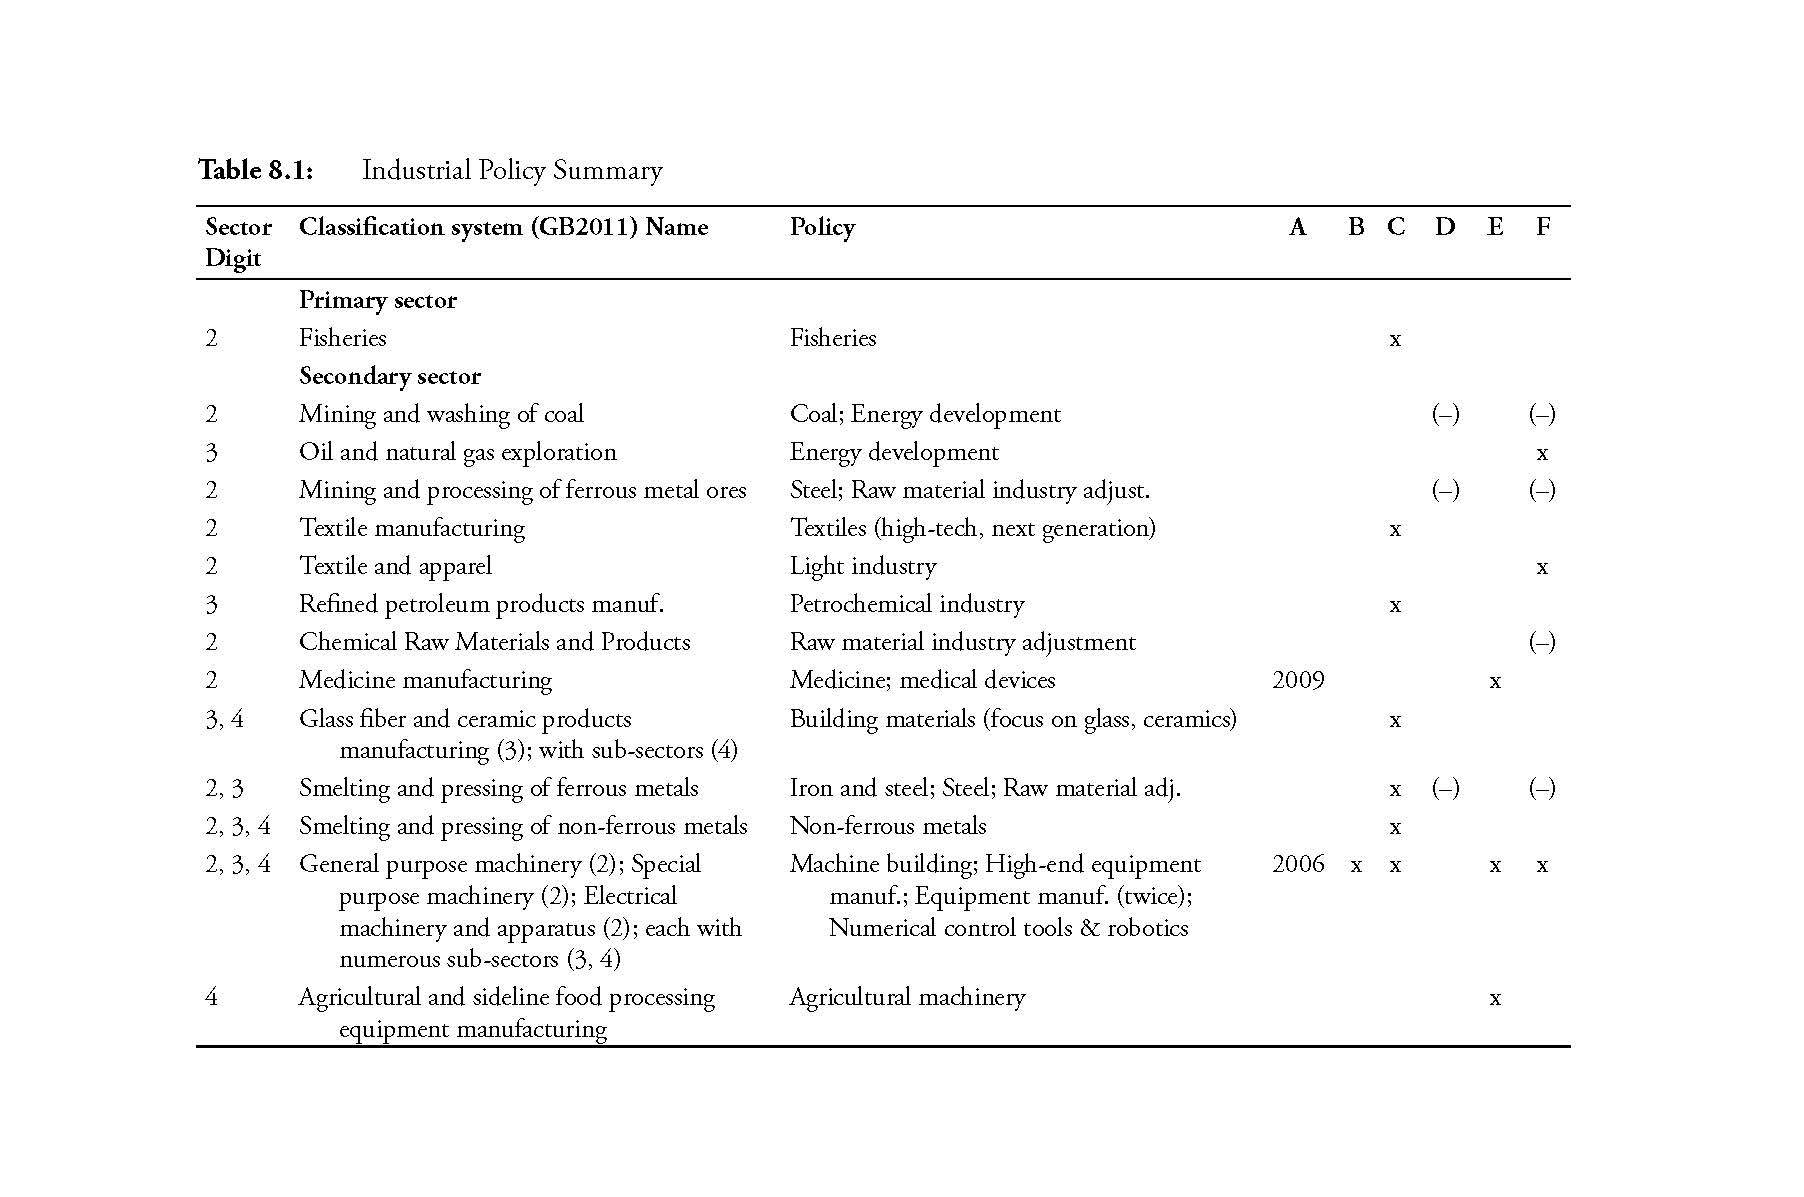
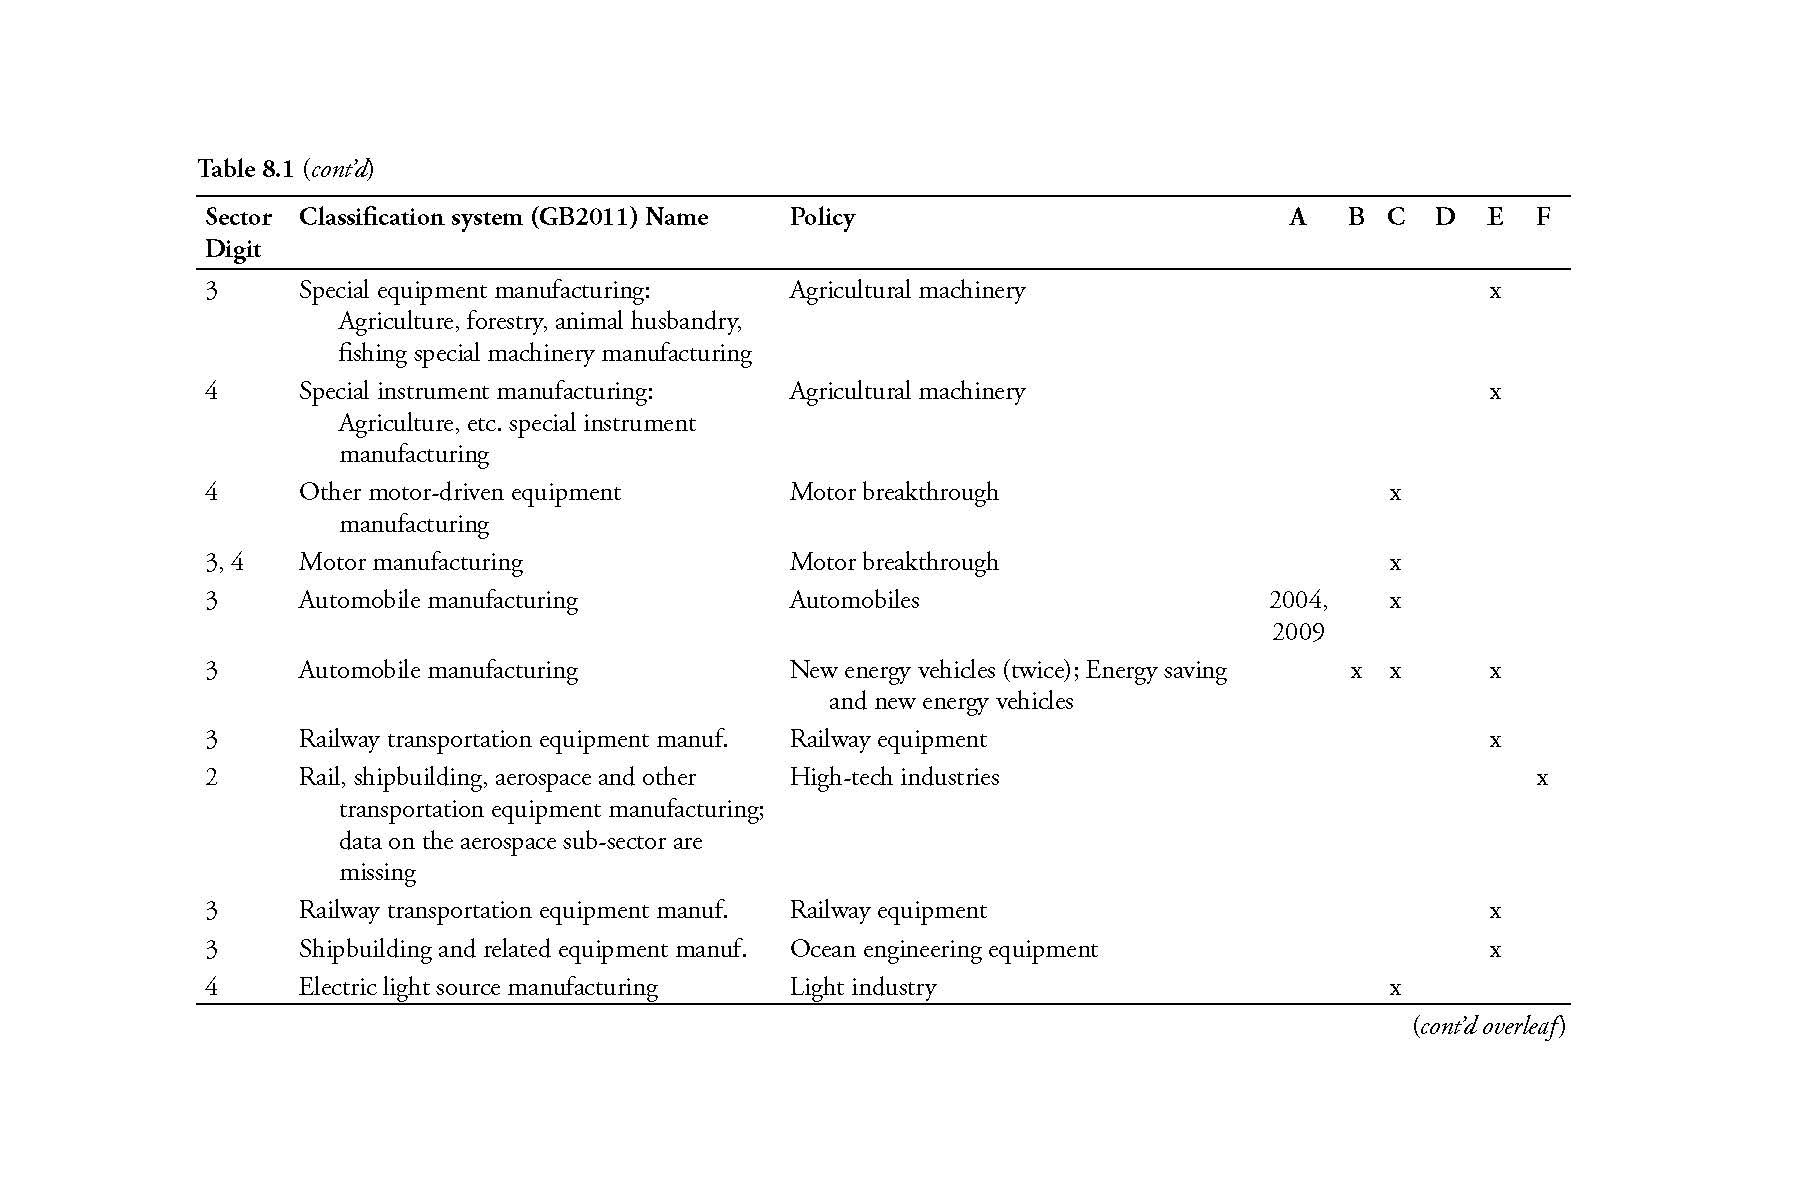
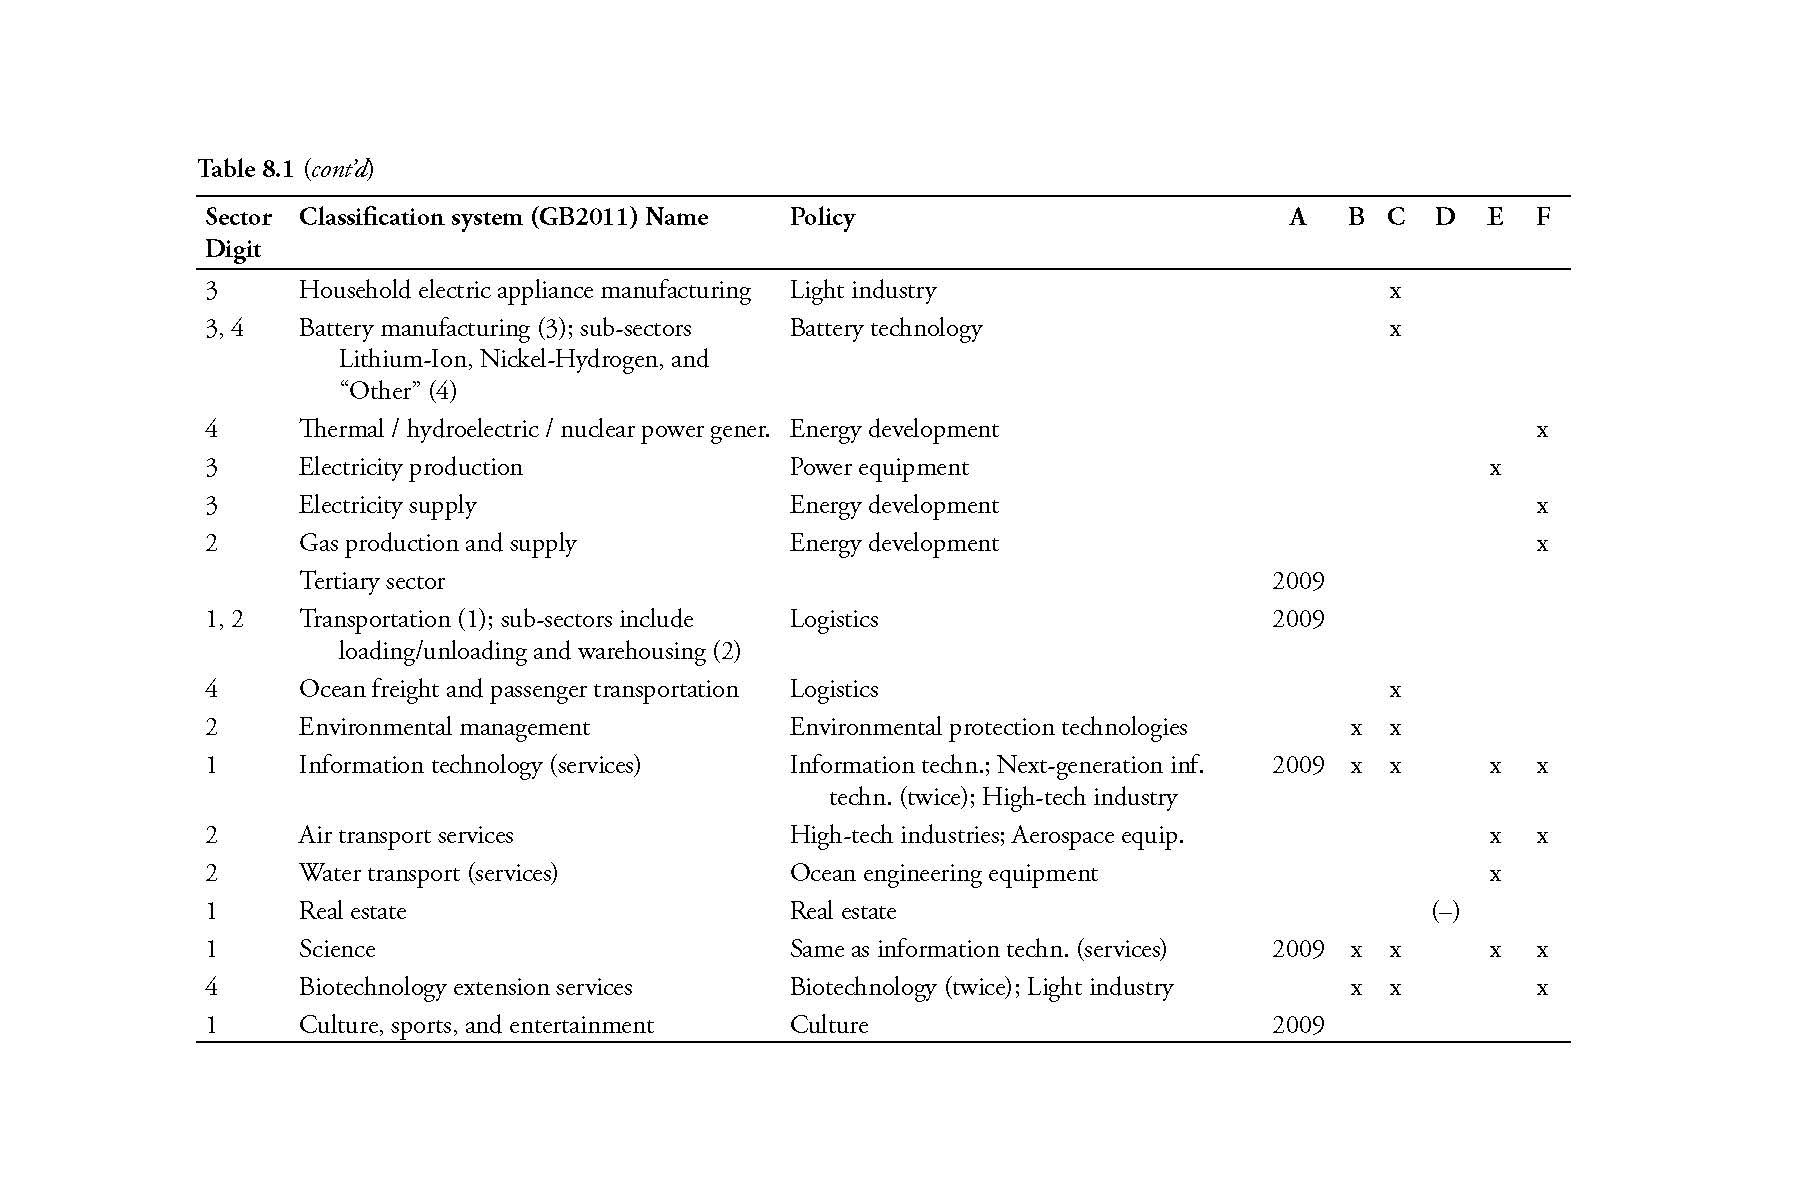
The industrial policies represent a combination of broad exhortations and specific objectives that are difficult to match into the official sector classification system along which the official investment data are organised. Even when specific objectives are given, including for types of projects, the objectives may cut across sectors or shift the balance of projects within a sector. Table 8.1 presents an attempt to map the six sets of policies to the greatest extent possible into the sector classification system (“GB2011”, the 2011 sector classification standard [guobiao]). For the various pre-2010 policies, a year is given in the table. For the subsequent five sets of policies, “x” denotes that this particular sector is covered (positively) by the policy and “(–)” that the policy constrains development in this sector.
Some examples illustrate the difficulty of matching industrial policies with sectors. The sector classification system includes a fourth-digit sector “biotechnology extension services” within the first-digit service sector “science” as the only potential counterpart to a policy promoting biotechnology. While there is a second-digit service sector “ecological protection and environmental management”, none of its sub-sectors is an immediate counterpart to a policy targeting “environmental protection technology”. There are no sector counterparts for policies on “new energy”, “new materials” or “new energy vehicles” (none of the automobile manufacturing sub-sectors refers to new energy vehicles or electric vehicles).[14]
Table 8.1: Industrial Policy Summary
- A: pre-2010 industrial policies.
- B: Strategic Emerging Industries (2010).
- C: Twelfth Five-Year Plan (2011–15).
- D: Supply-side Structural Reform Program (2015).
- E: Made in China 2025 (2015).
- F: Thirteenth Five-Year Plan (2016–20).
The NBS in December 2012 issued a trial sector classification system for the strategic emerging industries to match the State Council’s seven categories, further broken down into 30 sub-categories and 100 sub-subcategories, at which level a correspondence is being established with 359 sectors in the NBS’s official sector classification system.[15] The NBS emphasises that the correspondence is not exact not only in that a particular aspect of the strategic emerging industries may be reflected in more than one sector of the official sector classification system (which its matching exercise captures), but also in that some sectors of the official sector classification system may contain both strategic emerging industry aspects and other aspects (an issue the NBS cannot address).[16] No such NBS regulations were issued in the case of Made in China 2025, possibly following the Party’s recent attempts to downplay the policy.[17]
In 2013, in response to the 12th Five-Year Plan and to a guiding opinion of the State Council Office of 2011 on accelerated development of the high tech service sector, the NBS issued a trial sector classification scheme for high tech service industries (gaojishu chanye [fuwuye] [NBS 2013a]), followed by a separate document on high tech manufacturing industries, also of 2013 (NBS 2013b), in which the NBS identified six manufacturing categories as high-tech industries (pharmaceuticals, aviation, electronics and communication equipment, computer and office equipment, medical equipment, “information chemical” manufacturing [xinxi huaxuepin zhizaoye]) and matched them into 69 second through fourth-digit manufacturing sectors.[18]
Industrial Policies and Investment Growth
In this section, the question whether industrial policies affect sector investment patterns is addressed through regression analysis. Industrial policies are captured by dummy variables for each of the six policies identified above as well as for the NBS’ identification of strategic emerging industries and, separately, high-tech manufacturing industries.
Investment is measured as “Fixed Asset Investment” (FAI, guding zichan touzi). FAI is the sum of all fixed asset investment spending by firms.[19] Detailed sector and ownership data are available for a significant but changing subset of FAI over time: (i) in 2003–10, urban investment (accounting for 82 to 88 per cent of FAI); and (ii) since 2011, “investment, except by rural households” (accounting for 97 to 99 per cent of FAI).[20] In the following, the label “urban” investment will be used for both of these (sequential) subsets, independent of whether these are data of the years prior to 2011 or since that year. Due to three statistical breaks between 2009/2010 and 2012, the investment data are best analysed separately for the periods before and after the statistical breaks.[21] The investment data are in nominal terms; sector-specific investment deflators are not available.[22]
Factors other than industrial policies may affect investment. A prime competing explanatory variable for the observed investment patterns is profitability. Investment and profitability data can be matched, sector by sector, for mining, manufacturing and utilities (“industry”). What is available for industry is (limited) balance sheet and profit and loss account data for the above-norm industrial enterprises, a set of enterprises that accounts for approximately 90 per cent of industrial value-added. Assuming that profitability of above-norm industrial enterprises in a particular sector is representative of the profitability of all industrial enterprises in that sector, and that investment in industry is exclusively conducted by industrial enterprises, the investment and industry datasets can be combined.[23] Fourth-digit sector industry data are available for 2012–16 only (while fourth-digit sector investment data are available for 2003–12 and 2014–17).[24] Given the 2010 and 2015 policy interventions, regression analysis is conducted separately for the two periods 2012–15 and 2015–17.
Profitability is measured by return on assets (RoA).[25] Several control variables are included: (i) Sales growth represents market demand, with changes in market demand potentially triggering changes in investment. (ii) Different ownership forms, measured by their share in investment, may come with different investment behaviour. (iii) Investment per employee controls for capital intensity; investment potentially shifts away from or towards sectors with high capital intensity. It is measured in CNY million per employee, while all other variables are measured in percentages.
For the first period (2012–15), due to data limitations, sales growth data are those of 2013.[26] RoA is also of 2013. Because fourth-digit sector investment data are not available for 2013, ownership shares are those of 2014—ownership shares are quite stable between adjacent years and the particular choice of year should have little effect—as are the data on investment per employee (2012 employment data are missing in the industry statistics). For the second period (2015–17), sales growth data are those of 2015 compared to 2013, while RoA, ownership shares and investment per employee are of 2015.
Table 8.2: Explaining Investment Growth, 2012-2015


Table 8.2 reports the Ordinary Least Squares regression results for the first period (2012–15) across fourth-digit sectors plus those third-digit sectors for which no fourth-digit sector data are available.[27] Profitability has a significant positive impact on investment growth, as do sales growth and capital intensity (first column of Table 8.2). The investment share of state-owned and state-controlled units (SOSCUs) has a negative impact, while the shares of foreign-funded units (FFUs) and of Hong Kong, Macau and Taiwan units (HKMTUs) have no impact (second column); the omitted ownership group is entirely composed of non-state domestic units, for which no further breakdown is available.[28]
Of the six sets of industrial policies, only two have a significant effect (and with the expected signs): the supply-side structural reform programme of 2015 and Made in China 2025. Both effects occurred in the three years (2012–15) before the policy was initiated.
The NBS measure of strategic emerging industries (with a dummy variable for 236 fourth-digit sectors in industry identified by the NBS) shows no significant impact of this 2010 policy on the investment patterns of 2012–15.[29] The 62 high tech fourth-digit manufacturing sectors identified by the NBS in 2013 also have no significant impact.
Table 8.3: Explaining Investment Growth, 2015-2017

Table 8.3 reports the regression results for investment growth between 2015 and 2017. Sales growth and ownership matter, as before. The share of investment by FFUs and at times by HKMTUs is now also significant, with a positive impact on investment growth. The coefficient of capital intensity is consistently significant but now with a negative sign, indicating investment growth away from high capital intensity sectors, in contrast to the previous period of 2012–15.
Profitability in 2015 consistently plays no role in explaining investment growth. Data problems led the NBS to stop publishing detailed industry data starting in 2017, indicating potentially increasingly problematic profitability data. If the lack of significance were to reflect a real world phenomenon of profitability having no impact on investment patterns, this would open wide the door to alternative explanations including industrial policies.
The supply-side structural reform programme of 2015 had a barely significant (negative) correlation with investment growth in 2015–17, indicating a possible policy effect, except that investment changes in the industries targeted by the supply-side structural reform programme had already been well underway for several years before the policy was issued and the policy may simply coincide with an ongoing trend established years earlier. Made in China 2025 and the 13th Five-Year Plan, both of 2015, had a (significant) negative—rather than the expected positive—impact on investment growth in 2015–17.[30]
Combining all six policies in one and the same regression attests that the pre-2010 industrial policies had a negative impact—perhaps the policies were outdated as of 2015–17—and the Strategic Emerging Industry policy of 2010 had a positive impact on investment growth in 2015–17, half a dozen years later.
The coefficient of the NBS’ (2012) strategic emerging industries continued to be insignificant in the second period, while that of the NBS’ (2013) high-tech sectors was newly significant, as in the case of the Strategic Emerging Industry policy of 2010.
To summarise: In the first period, profitability, market demand, ownership characteristics and capital intensity exerted an unambiguous influence on investment growth. Industrial policies in the rare instances that they matter do so after the fact. In the second period, the effects of market demand and ownership characteristics persisted, while the effect of capital intensity turned negative. Profitability had no effect and generally neither did industrial policies; in the few instances when they had an effect they either carried the wrong sign or the effect occurred so many years after the policy was enacted that one wonders if the effect can still be attributed to the policy.[31]
The list of sectors that the NBS in 2012 deemed to correspond to strategic emerging industries was not limited to industry. Across construction and the tertiary sector—for which detailed data, such as on profitability, are not available—investment in NBS-identified fourth-digit strategic emerging industry sectors (including those third-digit sectors that did not contain fourth-digit sectors) grew faster than in those sectors not deemed subject to industrial policy, but the difference was not statistically significant (in both the 2012–15 and 2015–17 periods). The high-tech tertiary sectors identified by the NBS in 2013 equally performed no differently than other tertiary sectors, in both periods.[32]
The findings of the regression results can be illuminated further by delving into sector, administrative subordination and ownership patterns of investment. This is done in the following three sections.
Sector Distribution of Investment
In 2015, three-quarters of FAI was concentrated in four of the 19 first-digit sectors (Figure 8.1)—manufacturing (32 per cent), real estate (24 per cent), public facilities including environment (10 per cent) and transport (9 per cent)[33]—with manufacturing, public facilities/environment and transport (half of FAI) potentially the subject of industrial policies.
Figure 8.1: Central vs. Local Shares in “Urban” Investment, 2015 (%)

In the period 2012–15, investment in mining was stagnant (indicated by the crosses in Figure 8.1), predating the 2015 supply-side structural reform agenda. Manufacturing investment shows little (if any) impact from the various industrial policies favouring individual manufacturing sectors promulgated in the 12th Five-Year Plan. Investment in 2012–15 grew fastest in information technology (IT), business services, health, trade and science. Growth in IT and science conforms with the 2010 strategic emerging industries policy, but IT and science each still accounted for only 1 per cent of economy-wide investment in all three years 2012, 2015 and 2017. In 2015–17, the fastest-growing sectors were public facilities, business services, education and health, none of which—except environment within public facilities—is a sector favoured by industrial policies (dots in Figure 8.1). These sectors are followed by IT and science—sectors targeted by industrial policies—but also by culture and agriculture.
Data available for the approximately 100 second-digit sectors for the subset of “urban” investment further suggest that investment growth and industrial policies are not well aligned. Examining the periods 2003–08, 2008–10, 2012–15 and 2015–17 (the choice of periods being determined by data availability, statistical breaks and policy periods), the growth rates of “urban” investment correlate with industrial policies for some sectors but not for others; many sectors with high investment growth rates are not industrial policy sectors.
Figure 8.2: Second-digit Industrial Sector Investment Shares 2015 and Growth Rates (2012–15, 2015–17)

Notes: SOSCU: State-owned and state-controlled unit. COU: Collective-owned unit. HKMTU: Hong Kong, Macau, Taiwan unit. FFU: Foreign-funded unit.
Data coverage: Investment, except by rural households, for industry (mining, manufacturing, and utilities).
The sum of all bars across sectors (left-hand side scale) equals 39.9% of (economy-wide) “urban” investment.
In each bar, the ownership distribution begins from the bottom up. Thus, SOSCUs occupy the lowest segment of the bar, with private units the next segment up. (The shares of HKMTUs, FFUs, COUs, and of the residual tend to be relatively small and may not be easy to decipher in the chart.)
Source: NBS database, Statistical Yearbook 2016, 2017, 2018.
Figure 8.2 graphically extracts the second-digit industry sectors with their 2015 shares in “urban” investment—including an ownership breakdown that is discussed below—as well as the sector growth rates in per cent between 2012 and 2015 (crosses) and between 2015 and 2017 (dots), both measured on the right-hand side axis. All mining sectors experienced significant investment declines between 2015 and 2017, including a 23 per cent fall in investment in oil and natural gas extraction, a sector favoured by the 13th Five-Year Plan for 2016–20. Investment in both coal and ferrous metals, key sectors targeted for reduction by the Supply-side Structural Reform Programme of 2015, already fell significantly before 2015.
In manufacturing, a broad range of light industry sectors (the approximately first dozen manufacturing sectors) experienced above-average growth rates in both periods, even though industrial policies addressed none of these sectors except for the textile industry in the 12th Five-Year Plan. The furniture industry and the manufacture of cultural goods—not industrial policy sectors—stand out with exceedingly high growth rates in both periods.
Investment growth in 2015–17 was (newly) highest for computers (including communication and other electronic equipment), an industrial policy sector, at 43 per cent, followed by the furniture industry, not the target of industrial policy. The 18 per cent growth rate of electrical machinery and apparatuses may be in line with high-end manufacturing being promoted as a strategic emerging industry (2010) or numerical control tools and robotics being promoted by Made in China 2025 (2015), but investment in general purpose machinery and in special purpose machinery was unchanged (negative 1 per cent and 0 per cent growth). While the Strategic Emerging Industry policy (2010) promoted the development of electric vehicles, and Made in China 2025 the development of new energy vehicles, investment in the automobile industry rose an unremarkable 14 per cent in 2015–17 and a similarly average rate of 43 per cent in 2012–15. Overall, investment appears to grow fast in some industrial policy sectors and equally in some sectors not subject to industrial policy.
The coefficient of variation of investment growth across all second-digit sectors fell over time from 0.76 in 2003–2008 to 0.32, 0.34, and 0.25 in 2008–10, 2012–15 and 2015–17. This suggests a trend towards broad-based, economy-wide investment growth rather than any form of specialisation that could be the outcome of targeted industrial policies.
Extending the analysis to the third- and fourth-digit sector levels, changes in investment patterns across many of the sectors predate the respective industrial policies, and in some sectors concur. The fact that the 30 fastest-growing sectors together account for an ever smaller share of “urban” investment over time, by 2015 equal to only one-thirtieth of what one would expect that share to be given the average sector share, suggests that fast-growing investment in a particular sector primarily serves to develop a previously underdeveloped sector, implying a catch-up process or the completion of an industrial structure more than any kind of specialisation that would be favoured by targeted industrial policies.
Central Influence on Investment
Official statistics classify investment according to the level of government under which the investment occurs. “Central” investment denotes investment by enterprises, administrative facilities (shiye danwei), and administrative organs (xingzheng danwei)—in short, by “units”—directly subordinate to the Chinese Communist Party Central Committee, the National People’s Congress, and the State Council’s ministries, commissions, offices and companies.[34] All other investment is “local”: all projects by enterprises, administrative facilities, and administrative organs that are directly led and administered by provincial, municipal, and county governments and their relevant departments,[35] as well as private and foreign investment that is not subordinate to any administrative tier.
The central share in FAI declined from 13.3 per cent in 2003 to a mere 4.7 per cent in 2015 and 4.1 per cent in 2017, less than one-twentieth of FAI.[36] This extremely low share of central investment means that the central government’s direct impact on investment via units subordinate to it is small or near-negligible.
In the more detailed breakdown of local investment available for “urban” investment, the centre accounted for 5 per cent of investment in 2015, the provinces for 4 percent, the municipalities for 8 percent, the counties for 17 percent, and “others” for 65 per cent (Figure 8.3).[37] The centre has a relatively high investment share in mining, utilities and transport; the provinces in transport; the municipalities in transport and across all tertiary sectors; and the counties in construction, transport, public facilities, education, health and public management. These are largely public goods, not industrial policy sectors.[38]
Across sectors, central investment is highly correlated with provincial investment (Pearson correlation coefficient of 0.93), and correlated to a continuously decreasing degree with municipal, county and then “other” investment (other: 0.27). The same pattern holds for the correlation between provincial investment and municipal/county/ “other” investment, and finally municipal investment (vs. county, “other”). This gradation in correlations suggests the existence of tier-specific—rather than industrial policy—investment preferences, with some flexibility in investment assignments between adjacent tiers.
Even if the centre wanted to implement industrial policies via local government investment, implementation might not be straightforward since lower-level governments might have little interest in implementing central policies. The further removed a particular tier is from the centre, the less responsive it will likely be to central policies (while the tier’s share in “urban” investment increases with the distance to the centre).
“Other” investment—principally private investment outside the control of government—is the dominant form of investment in more than half of all first-digit sectors, in particular in manufacturing (where it accounts for 87 per cent of investment) and in real estate (69 per cent), but also in agriculture, trade, business services, science and household services. The share of “other” investment is lowest in transport (29 per cent), education (34 per cent) and public management (34 per cent), namely, in public goods sectors.
Figure 8.3: Central vs. Local Shares in “Urban” Investment, 2015 (%)

Notes: The unabbreviated sector labels are: Agriculture, Forestry, Animal Husbandry and Fishery; Mining; Manufacturing; Production and Supply of Electricity, Heat, Gas and Water; Construction; Wholesale and Retail Trade; Transport, Storage and Post; Hotels and Catering Services; Information Transmission, Software and Information Technology; Financial Intermediation; Real Estate; Business Services and Leasing; Scientific Research and Technical Services; Management of Water Conservancy, Environment and Public Facilities; Service to Households, Repair and Other Services; Education; Health and Social Services; Culture, Sports and Entertainment; Public Management, Social Security and Social Organisations.
Source: Investment Statistical Yearbook 2016.
Data on sources of investment funding paint a similar picture of limited direct government influence on investment. In 2017, the share of state budget appropriations in investment financing was only 6 per cent (Figure 8.4), much of which was expended on public goods projects.
Figure 8.4: Sources of Investment Funding (shares in total in %)

Note: The same statistical breaks as noted earlier for the years 2010-2012 apply but are ignored here since the data here represent shares in the (variably defined) totals.
Source: Investment Statistical Yearbook 2018.
Domestic loans accounted for 11 per cent of investment funding. Policy lending could target firms in industrial policy sectors and thereby increase the share of potentially policy-directed funding by a few percentage points. “Industrial guidance funds”—such as the Integrated Circuit Industry Fund, funded through the state budget, bank loans and financial contributions by various state-owned enterprises and state entities—may seem large in size but pale in comparison to overall state investment, which in turn pales in comparison to economy-wide investment.[39]
The shares of “own” and “other” funds in 2017 were 65 and 17 per cent (and that of foreign funds was 0.3 per cent). The allocation of “own” funds would seem solely at the discretion of the investing unit. One caveat, however, is that “own” funds include—besides “private capital” (ziyou zijin) of firms and institutions (presumably retained earnings)—“funds collected from other units”. Thus, some of the “own funds” could have been obtained, for example, by issuing bonds, which could be subject to government approval.
Ownership Distribution of Investment
A breakdown of investment by ownership is available for “urban” investment. A first distinction is between domestic investment vs. investment by “Hong Kong, Macau and Taiwan units” (HKMTUs) and by foreign-funded units (FFUs). Domestic investment accounted for 89 per cent of “urban” investment in 2003 and continuously increased to 96 per cent in 2017. The investment shares of HKMTUs and FFUs correspondingly decreased, from 5 per cent and 6 per cent in 2003 to 2 per cent each in 2017 (Figure 8.5).
Figure 8.5: Investment Shares by Ownership, “Urban” Investment 2003–17 (%)

Notes: SOSCU: State-owned and state-controlled unit. COU: Collective-owned unit. HKMTU: Hong Kong, Macau, Taiwan unit. FFU: Foreign-funded unit. “Residual” is the implicit residual obtained as domestic investment less investment by SOSCUs, COUs and private units.
In 2010, the size criterion for inclusion in urban investment increased from CNY500,000 to CNY5 million (the NBS retrospectively revised the 2010 data), and in 2011 coverage switched from urban investment to “investment, except by rural households”.
The HKMTU and FFU shares are indistinguishable after 2010.
Source: NBS database, Statistical Yearbook 2018.
The breakdown of domestic investment available since 2008 shows investment by private units on a steady upward trend which exceeds investment by state-owned and state-controlled units (SOSCUs) starting in 2010.[40] By 2015, private units accounted for more than half of investment (51 per cent), SOSCUs, after a phase of decline, for 32 per cent, and collective-owned units (COUs) for 4 per cent. An undefined implicit residual grew from 1 per cent in 2008 to 8 per cent in 2015. In 2016 and 2017 the SOSCU share rebounded (while the private share fell slightly), possibly due in part to reclassifications.
To graphically illustrate the principal ownership patterns across sectors, Figure 8.6 shows the ownership shares within each first-digit sector in 2015.[41] The extent of private investment in manufacturing and in real estate—the two largest sectors, together accounting for more than half of investment—is immediately apparent. Across the manufacturing sectors, key targets of industrial policies, SOSCUs in 2015 accounted for only 7 per cent of investment, while private units accounted for 78 per cent. Overall, private investment is dominant across half of all sectors, with a smaller presence in typical public goods sectors.
Investment by SOSCUs is substantial in utilities, construction, transport, information technology, finance, public facilities, education, health, culture and public management, none of which, except for information technology, is an industrial policy sector. Investment by COUs is spread across all sectors, while small shares of investment by FFUs and HKMTUs are present across two-thirds of all sectors, mostly in manufacturing, IT and real estate.
Figure 8.2 (above) includes ownership information for the second-digit industry sectors in 2015. SOSCUs are the dominant investors in the extraction of petroleum and natural gas, in the tobacco industry, in electricity production, and in water supply, all of which are monopoly or near-monopoly sectors. Otherwise, sector by sector, private units provide the lion’s share of investment. COUs play a negligible role across all sectors (barely visible in the figure), while FFUs and HKMTUs (together) play a minor role in half a dozen sectors and have a minimal presence across other sectors.[42]
Figure 8.6: Investment (except by Rural Households) by Sector and Ownership, 2015

Notes: SOSCU: State-owned and state-controlled unit. COU: Collective-owned unit. HKMTU: Hong Kong, Macau, Taiwan unit. FFU: Foreign-funded unit.
For unabbreviated sector labels, see notes to Figure 8.3.
“Residual” is the implicit residual obtained as domestic investment less investment by SOSCUs, COUs, and private units.
Source: NBS database.
The distribution of private investment across sectors and its dominance in the non-public goods sectors imply that implementation of industrial policy, to a very large degree, has to rely on private entrepreneurs. Shih (2014), in a monograph on the PRC’s industrial policy programmes from 1978 through 2013, concluded that industrial policy in the PRC was introduced to replace imperative planning and therefore exclusively targeted state-owned enterprises. The industrial policies of the last decade appear to be more inclusive and are, at least in language, not limited to state-owned enterprises. But forcing or incentivising the private entrepreneurs who account for the bulk of investment in industrial policy sectors to do the state’s (policy) bidding is likely difficult.
Conclusions
Regression analysis suggests that industrial policies have little or no effect on investment outcomes in industry. At least through 2015, investment is driven primarily by profitability considerations. When industrial policies have an effect, changes in investment patterns precede industrial policy. Similarly, Naughton (2019: 183) in a different context finds that “policymakers are happy to pick winners after the event”. And Wang (2018) argues that “China’s technological success is driven by its top companies rather than government planning”.[43] A caveat would be that industrial policies could have been circulated internally well before being formally announced.
Given that industrial policy sectors are dominated by privately owned firms, breakthroughs such as those envisaged by Made in China 2025 may be more likely to occur if the government offers profitability-enhancing incentives. But with diverging interests between central government departments and localities and with policy documents that number in the hundreds, supporting measures could well end up supporting everything and (thereby) nothing, or be misallocated (for which there is some evidence). The sectoral patterns of investment growth over the past two decades suggest that investment grows particularly fast in underdeveloped sectors of the economy rather than in a small selection of sectors targeted by industrial policy, indicating a catch-up process and completion of a broad industrial structure.
The impression arises that different departments—each favouring projects beneficial to its mission or institutional interests—compete in issuing industrial policy document after document, filling each generation of central leaders’ latest “guidance” and “strategies” with meaning, while the economy largely develops according to market principles. Industrial policies may well have some impact only when a department manages to command significant financial resources towards a particular end.[44]
The NBS’ difficulty in matching policies into the sector classification system suggests that policy makers are unable or unwilling to unambiguously identify industrial policy sectors to begin with. Industrial policy appears to be not so much sector-specific as project-specific policy, accompanied by a sweeping exhortation across the five-year plans and other industrial policy documents to “upgrade” every aspect of the economy. This industrial policy is not one in the traditional sense of sector-specific policies that apply equally to all market participants. Rather, it is formed of project-targeted interventions accompanied by guidelines for bureaucrats as to what they are expected to favour by all means available to them, from development funds to various administrative measures.
The findings in this chapter contrast with evidence of the effects of the PRC’s industrial policies provided elsewhere in the literature. For example, state sponsorship helped Huawei develop its 5G capabilities (via practically free 5G spectrum, research funding and state-led demand for Huawei products) and helped the China Railway Rolling Stock Corporation (CRRC) modernise and compete globally; it created the PRC’s telecommunications behemoths and the PRC’s solar photovoltaic panel industry; and it turned the PRC’s shipbuilding industry into a global force. But at the macro level examined in this chapter, industrial policy does not have a decisive effect on resource allocation. That implies either that these examples are exceptions (highly selective cases, targeted projects) or that industrial policy in these cases was not crucial for their success to begin with.
Notes
[1] This chapter includes some (updated and expanded) earlier analysis by the author (Holz 2019).
[2] For a description of the earlier investment procedures in effect through the mid-1990s, see Huang (1996a, 1996b). On increasing encouragement of private investment in the 2000s, see Lardy (2014: 91ff.).
[3] Each set of industrial policies comprises the initial document and follow-up instructions and corresponding documents issued by central ministries as well as provincial and municipal governments. Prud’homme (2016) found more than 300 documents for the case of the 2010 Strategic Emerging Industry policy alone.
[4] Heilmann and Shih (2013) provide a list of industrial policies, here augmented and categorised.
[5] These sectors for revitalisation include, with concrete plans for 2009–11, the automobile industry, biology and medicine industry, equipment manufacturing and new energy (see China Briefing [2009]), all of which were later integrated into the Twelfth Five-Year Plan (2011–15).
[6] See section 10 of the Twelfth Five-Year Plan. Some of the subsequent sections cover aspects of the seven strategic emerging industries, though the term “strategic emerging industries” does not always appear.
[7] Articles by an “authoritative personage” in Renmin ribao (People’s Daily) on 4 Jan. and 9 May 2016 widely promoted the supply-side structural reform agenda.
[8] The four revolutions are: water- and steam-powered mechanical manufacturing, mass production based on electric power, automation of manufacturing based on information technology, and cyber-physical systems (smart factories with embedded information technology systems).
[9] Wang (2018) argued that the PRC’s success in the technology industry has been in downstream consumer goods; Made in China 2025 is an attempt to catch up in the upstream, component-supplying sectors such as semiconductors.
[10] Explicit reference is made to “strategic emerging industries” once, as part of an introductory passage on strengthening the manufacturing capacity of the PRC.
[11] See the English-language State Council webpage that promotes Made in China 2025 events, decisions and achievements (State Council 2020).
[12] The industry section is titled “Promote the Optimization and Upgrading of the Industrial Structure”. Other sections address development of the service industry, regional balancing, and energy saving and environmental protection.
[13] The term “strategic emerging industries” does not appear in the plan. Kenderdine (2017) shows the policy consistency from “Strategic Emerging Industries” to Made in China 2025 and the 13th Five-Year Plan.
[14] Aerospace equipment, one of the ten priority industries of Made in China 2025, can be matched directly with the third-digit sector “aviation and aerospace equipment manufacturing” (with further, four fourth-digit sectors). But in the investment statistics, checked for 2012–17 values, this third-digit sector is missing.
[15] The trial sector classification system was issued explicitly in response to the State Council’s 10 October 2010 decision and to assist in the implementation of the 12th Five-Year Plan. An updated version of the document, adopting the new sector classification system GB2017 (replacing GB2011), was issued in 2018 (NBS 2018b). It still refers to the State Council’s 2010 policy but now also refers to the 13th Five-Year Plan.
[16] As an example for the latter case, the NBS selects all of “agriculture” in the sector classification system to match “agricultural biotechnology applications” in the strategic emerging industries policy.
[17] Li and Alon (2019) point out that following the reactions abroad to the PRC’s Made in China 2025, the Party has banned the media from discussing Made in China 2025.
[18] Most recently, Party and State Council issued “guidance” on acceleration of the development of the “Three New” (new industry, new undertakings, new commerce [xin chanye xin yetai xin shangye]). The NBS on 14 August 2018 then issued a circular on the sector classification of the “Three New”. The matching into the sector classification system is based on the 13th Five-Year Plan, Made in China 2025 and further listed documents.
[19] Holz (2019, 2020) provides a detailed discussion of the investment data. Key sources of investment data are the Statistical Yearbook, the Investment Statistical Yearbook and the NBS database available online.
[20] The difference between the two subsets is that the earlier excludes investment not just by rural households but also by rural non-households, that is, it excluded all rural investment.
[21] The three statistical breaks are: (1) In 2011, the urban-rural distinction evolved into a distinction between “investment, except by rural households” (for which detailed data are available) and “investment by rural households”, accounting for 97 per cent and 3 per cent of total investment, respectively. (2) Since 2011, the new minimum urban investment size to be included in the statistics is CNY 5 million, ten times higher than the size criterion previously applied through 2010 to “urban investment”, of CNY 500,000. (3) The sector classification system was adjusted in 2012 with a switch from GB 2002 to GB 2011. For details on the transition in the classification system, statistical breaks and coverage changes over time see Holz (2013, 2020).
[22] Neither nominal nor real (inflation-adjusted) FAI data are the obviously preferred choice.
[23] Above-norm industrial enterprises are industrial enterprises with annual sales revenue from principal business above (since 2011) CNY 20 million. The data source is the Industry Statistical Yearbook.
[24] The availability of data coincides with the consistent use of one sector classification system (GB2011) during the period 2012–17. A new sector classification system was introduced in 2017 (GB 2017) but the published 2017 fourth-digit sector investment data still adhere to the previous classification system.
[25] Alternatively, one could use return on equity (with near-identical results).
[26] With investment growth measured for the period 2012–15, a preferred sales growth measure might cover the period 2012 vs. 2011, but 2011’s fourth-digit sector industry data are not available (and data for earlier years follow the different, earlier sector classification system).
[27] The NBS sector classification systems present these third-digit sectors with two numbers: a third-digit sector number, and the same number with a zero added at the end to denote a fourth-digit sector.
[28] Ownership can also be measured by the registration-based share of different ownership forms in paid-in equity. The shares of the state and of “individuals” tend to be negative and significant, while those of FFUs and HKMTUs tend to be positive and significant. All other registration forms have no significance.
[29] The NBS identifies an additional eight second-digit sectors. These are not used because the NBS typically has identified a selection of fourth-digit sectors as relevant.
[30] Across all regressions involving a dummy variable for the 13th Five-Year Plan, the dummy variable was assigned the value one only for those sectors favoured by the 13th Five-Year Plan. Interaction terms of individual industrial policies and the investment share of SOSCUs tended to be insignificant.
[31] The explanatory power of the regressions (as measured by the R2) was relatively low throughout. In 2015–17, variation in the explanatory variables typically explained about 15 per cent of the variation in investment growth. This suggests that other sector-specific characteristics may play an important role for investment growth.
[32] The comparison of means is based on investment growth rates across policy sectors vs. non-policy sectors.
[33] The corresponding percentages in 2012 and 2017 were similar (35/30, 26/23, 8/13, and 9/10 per cent).
[34] For the definition see the NBS (http://www.stats.gov.cn/tjsj/zbjs/201310/t20131029_449538.html, accessed 31 Jan. 2017). The website gives examples of such units, including the NBS local survey teams (directly subordinate to the NBS), the Industrial and Commercial Bank of China, China Telecom and PetroChina.
[35] Presumably, in parallel to the practice at the central level, local Party organs and people’s congresses are included in the category “local”.
[36] NBS database and Investment Statistical Yearbook.
[37] In 2017, the percentages were similar with 4, 4, 10, 20 and 62 per cent.
[38] The centre’s 21 per cent share in mining may be a historical remnant, with land a key state resource, while the centre’s 21 per cent share in utilities reflects ownership of the nationwide electricity grid and gas supply.
[39] On such industrial guidance funds see, for example, Naughton (2019), Wübekke et al (2016) and Zenglein and Holzmann (2019).
[40] “State-owned and state-controlled units” refers to the following units: traditional (unincorporated) state-owned units, joint state-state units, 100 per cent state-owned limited liability companies, and all other units (typically limited liability and stock companies) in which the state has an absolute or de facto controlling stake. For a discussion of the impact of the statistical breaks on the ownership shares see Holz (2019).
[41] The charts for 2012 and 2017 look very similar and a time series comparison is therefore omitted.
[42] Yet more dis-aggregated data show FFU investment to be highly concentrated in a very few sectors. But even in highest-concentration FFU sectors, such as automobile manufacturing or computer manufacturing, FFUs do not account for more than 15 per cent of investment.
[43] Wang (2018) uses Huawei as an example to show how the government in earlier years hampered the growth of a well-run company in order to boost a state-owned rival that ultimately was not successful.
[44] Reportedly, half of all of the PRC’s R&D occurs in little more than 500 firms. Narrow targeting of industrial policy measures would match such a concentration of R&D.
References
Aghion, Philippe et al. 2015. “Industrial Policy and Competition”, American Economic Journal: Macroeconomics 7, 4: 1–32.
Amsden, Alice H. 1994. “Why Isn’t the Whole World Experimenting with the East Asian Model to Develop?: Review of The East Asian Miracle”, World Development 22, 4: 627–33.
Ballard, Will. 2019. “Chinese Biotech: From Copycat to Innovator”, Financial Times, 10 Oct. 2019. Available at https://www.ft.com/content/03812ddf-84a3-4540-9850-9a33cfe637d0 [accessed 7 Nov. 2019].
Barwick, Panle J., Myrto Kalouptsidi and Nahim Bin Zahur. 2019. China’s Industrial Policy: an Empirical Evaluation. Cambridge, MA: NBER Working Paper No. 26075.
China Briefing. 2009. “Revitalization Programs Set for Five Industries”. Available at https://www.china-briefing.com/news/revitalization-programs-set-for-five-industries/ [accessed 18 Nov. 2020].
Eberle, Jonathan and Philipp Boeing. 2019. Effects of R&D Subsidies on Regional Economic Dynamics: Evidence from Chinese Provinces. China Center for Economic Research, Working Paper Series E2019004.
Heilmann, Sebastian and Shih Lea. 2013. The Rise of Industrial Policy in China, 1978–2012. Harvard-Yenching Institute Working Paper Series 2013.
Holz, Carsten A. 2011. “The Unbalanced Growth Hypothesis and the Role of the State: the Case of China’s State-owned Enterprises”, Journal of Development Economics 96, 2: 220–38.
________. 2013. “Chinese Statistics: Classification Systems and Data Sources”, Eurasian Geography and Economics 54, 5/6: 532–71.
________. 2019. “Industrial Policies and the Changing Patterns of Investment in the PRC Economy”, The China Journal 81: 23–57.
________. 2020. “Understanding PRC Investment Statistics”. China Economic Review 61, issue C. Available at https://www.sciencedirect.com/science/article/abs/pii/S1043951X20300584 [accessed 19 Nov. 2020].
Huang Yasheng. 1996a. “Central-local Relations in China During the Reform Era: The Economic and Institutional Dimensions”, World Development 24, 4: 655–72.
________. 1996b. Inflation and Investment Controls in China: The Political Economy of Central-local Relations During the Reform Era. New York: Cambridge University Press.
Industry Statistical Yearbook. Various years. Zhonggtuo gongye tongji nianjian [(China) Industry Statistical Yearbook]. Beijing: Zhongguo tongji chubanshe.
Investment Statistical Yearbook. Various years. Zhonggtuo guding zichan touzi tongji nianjian [(China) Fixed Asset Investment Statistical Yearbook]. Beijing: Zhongguo tongji chubanshe.
Kenderdine, Tristan. 2017. “China’s Industrial Policy, Strategic Emerging Industries and Space Law”, Asia & The Pacific Policy Studies 4, 2: 325–42. [Also available at https://onlinelibrary.wiley.com/doi/epdf/10.1002/app5.177]. [accessed 7 Feb. 2021].
Lardy, Nicholas R. 2014. Markets Over Mao: The Rise of Private Business in China. Washington, DC: Peterson Institute for International Economics.
Li Shaomin and Ilan Alon. 2019. “China’s Intellectual Property Rights Provocation: A Political Economy View”, Journal of International Business Policy, 3 Sept. 2019. Available at https://doi.org/10.1057/s42214-019-00032-x [accessed 19 Nov. 2020].
Naughton, Barry. 2016. “Supply-side Structural Reform: Policy-makers Look for a Way Out”, China Leadership Monitor 49 (1 March 2016). Available at https://www.hoover.org/profiles/barry-naughton [accessed 19 Nov. 2020].
________. 2019. “Financialisation of the State Sector in China”, in China’s Economic Modernisation and Structural Changes: Essays in Honour of John Wong, ed. Zheng Y. and Tong S. Y. Singapore: World Scientific, pp. 167–85.
NBS [National Bureau of Statistics]. 2011. Guomin jingji hangye fenlei zhushi, 2011 [National economic sector classification, 2011]. Beijing: Zhongguo tongji chubanshe. Available at http://www.stats.gov.cn/tjsj/tjbz/ [accessed 14 October 2019].
________. 2012. Zhanluexing xinxing chanye fenlei (2012) shixing [Strategic emerging industries trial sector classification (2012)]. Available at http://www.stats.gov.cn/tjsj/tjbz/ [accessed 14 Oct. 2019].
________. 2013a. Gaojishu chanye (fuwuye) fenlei (2013) (shixing)). [High tech sector trial classification (services), 2013]. Available at http://www.stats.gov.cn/tjsj/tjbz/ [accessed 14 Oct. 2019].
________. 2013b. Gaojishu chanye (zhizaoye) fenlei (2013). [High tech sector classification (manufacturing), 2013]. Available at http://www.stats.gov.cn/tjsj/tjbz/ [accessed 14 Oct, 2019].
________. 2017. Guomin jingji hangye fenlei (2017) [National economic sector classification, 2017]. Available at http://www.stats.gov.cn/tjsj/tjbz/ [accessed 14 Oct. 2019].
________. 2018a. Xin chanye xin yetai xin shangye moshi tongji fenlei (2018) [New industry, new undertakings, new commerce (2018)]. Guo tong zi #111/2018. Available at http://www.stats.gov.cn/tjsj/tjbz/ [accessed 14 Oct. 2019].
________. 2018b. Zhanluexing xinxing chanye fenlei (2018). [Strategic emerging industries sector classification (2018)]. Available at http://www.stats.gov.cn/tjsj/tjbz/ [accessed 14 Oct. 2019].
NBS Database. National Bureau of Statistics Statistical Database. Available at http://www.stats.gov.cn.
NDRC [National Development and Reform Commission]. 2005. Chanye jiegou tiaozheng zhidao mulu [Guidance catalogue for adjustment of the industrial structure] (with State Council approval). Available at http://www.sdpc.gov.cn/fzgggz/fzgh/zcfg/200512/t20051222_65963.html [accessed 8 Feb. 2017].
________. 2013. Chanye jiegou tiaozheng zhidao mulu (2011) [Guidance catalogue for adjustment of the industrial structure, 2011]. Available at http://www.gov.cn/gzdt/att/att/site1/20110426/001e3741a2cc0f20bacd01.pdf [accessed 19 Nov. 2020].
———. 2017. Zhanluexing xinxing chanye zhongdian chanpin he fuwu zhidao mulu 2016 [Guiding catalogue for key products and services in the strategic emerging industries, 2016]. Available at http://www.ndrc.gov.cn/gzdt/201702/t20170204_837246.html [accessed 18 Dec. 2017].
Prud’homme, Dan. 2016. “Dynamics of China’s Provincial-level Specialization in Strategic Emerging Industries”, Research Policy 45, 8: 1586–603.
Rodrik, Dani. 2004. “Industrial Policy for the Twenty-First Century”, Mimeo September.
Rutherford, Donald. 1992. The Dictionary of Economics. London: Routledge.
Shih, Lea. 2014. Chinas Industriepolitik von 1978–2013: Programme, Prozesse und Beschränkungen [China’s industrial policy 1978–2013: programme, processes and limitations]. Wiesbaden: Springer, 2014.
Soo Zen and Meng Jing. 2019. “How China Is Still Paying the Price for Squandering Its Chance to Build a Home-grown Semiconductor Industry”, South China Morning Post, 4 Sept. Available at https://www.scmp.com/tech/big-tech/article/3024687/how-china-still-paying-price-squandering-its-chance-build-home-grown [accessed 7 Nov. 2019].
State Council. 2004. Decision on Reform of the Investment System. Guofa 20/2004. Available in English at http://en.ndrc.gov.cn/policyrelease/200602/t20060207_58851.html [accessed 8 Feb. 2017].
________. 2010. Guanyu jiakuai peiyu he fazhan zhanluexing xinxing chanye de jueding [Decision on accelerating cultivation and development of strategic emerging industries]. Available at http://www.gov.cn/zwgk/2010-10/18/content_1724848.htm [accessed 19 Nov. 2017]; for an English language summary of the State Council document see The US-China Business Council (2013).
________. 2015. Zhongguo zhizao 2025 [Made in China 2025], Guofa 28 / 2015. Available at http://www.gov.cn/zhengce/content/2015-05/19/content_9784.htm [accessed 19 Nov. 2020].
________. 2020. “Made in China 2025”. Available at http://english.www.gov.cn/2016special/madeinchina2025/ [accessed 18 Nov. 2020].
Statistical Yearbook. Various years. Zhonggtuo tongji nianjian [(China) Statistical Yearbook]. Beijing: Zhongguo tongji chubanshe.
The US-China Business Council. 2013. China’s Strategic Emerging Industries: Policy, Implementation, Challenges, & Recommendations. Available at https://www.uschina.org/sites/default/files/sei-report.pdf [accessed 19 Nov. 2020].
Thirteenth Five-Year Plan. 2016. Guomin jingji he shehui fazhan di shisan ge wunian guihua gangyao (quanwen) [Outline of the thirteenth Five-Year Plan for national economic and social development (full text)]. Available at http://www.gov.cn/xinwen/2016-03/17/content_5054992.htm [accessed 19 Nov. 2020].
Twelfth Five-Year Plan. 2011. Guomin jingji he shehui fazhan di shi’er ge wunian guihua gangyao (quanwen) [Outline of the twelfth Five-Year Plan for national economic and social development (full text)]. Available at http://www.gov.cn/2011lh/content_1825838.htm [accessed 19 Nov. 2020].
Wade, Robert. 1988. “State Intervention in ‘Outward-looking’ Development: Neoclassical Theory and Taiwanese Practice”, in Developmental States in East Asia, ed. Gordon White. London: MacMillan, pp. 30–67.
________. 1990. Governing the Market: Economic Theory and the Role of Government in East Asian Industrialization. Princeton, NJ: Princeton University Press.
Wang Dan. 2018. “Why China Can Succeed in Tech”, Gavekal Dragonomics Ideas, 19 Dec.
Wu Yiyun, Zhu Xiwei and Nicolaas Groenewold. 2019. “The Determinants and Effectiveness of Industrial Policy in China: A Study Based on Five-Year Plans”, China Economic Review 53: 225–42.
Wübekke, Jost et al. 2016. Made in China 2025: The Making of a High-tech Superpower and Consequences for Industrial Countries, (Mercator Institute for China Studies) MERICS Papers on China No. 2, Dec. Available at https://www.merics.org/en/papers-on-china/made-china-2025 [accessed 19 Nov. 2020].
Zenglein, Max J. and Anna Holzmann. 2019. Evolving Made in China 2025: China’s Industrial Policy in the Quest for Global Tech Leadership. (Mercator Institute for China Studies) MERICS Papers on China No. 8, 2 July. Available at https://www.merics.org/en/papers-on-china/evolving-made-in-china-2025 [accessed 22 Oct. 2019].